early experiments
One of the main challenges of the project was to reduce the huge amount of information coming from my research to the essential, turning information into insight.

Visualization of coffee production chain costs distribution

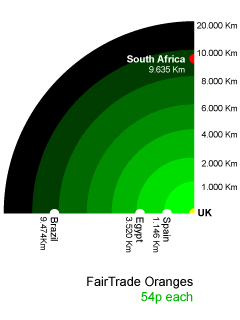
Skecth for a mobile app to visualize product traveling distance

Sketch: visualization of products carbon footrpint in relation to prices

Sketch: visualization of products carbon footrpint during shopping

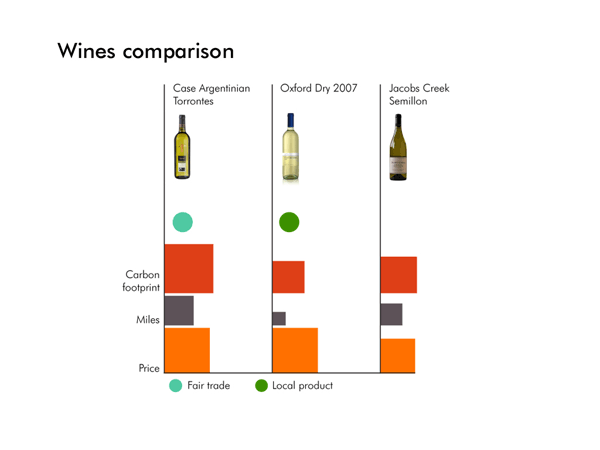
Sketch: comparison of different parameters for 3 wine bottles

Sketch: comparison of 1 parameters for 3 wine bottles

Sketch: comparison of 1 parameters for 3 wine bottles